
Design an Automated Time-Temperature Graph Plotter | 2016
- Nirosh Jayasuriya

- Jun 7, 2020
- 1 min read
University of Moratuwa, Supervised by Dr Y.W.R. Amarasinghe
In the late 17th century AD English physicist Sir Isaac Newton stated that the rate of heat loss of a body is proportional to the difference in temperatures between the body and its surroundings. This result is summarized in Newton’s Cooling Law.
The experiment used to observe this result is often time consuming and can take between 30 minutes to a few hours depending on the result required. And the experimenting conditions can be harsh laboratory conditions. Also, the changes in temperature can be very small that it will not be detected by a normal laboratory thermometer. This makes drawing an accurate graph difficult. And in normal situation you need to first get the readings and plot the graph later.
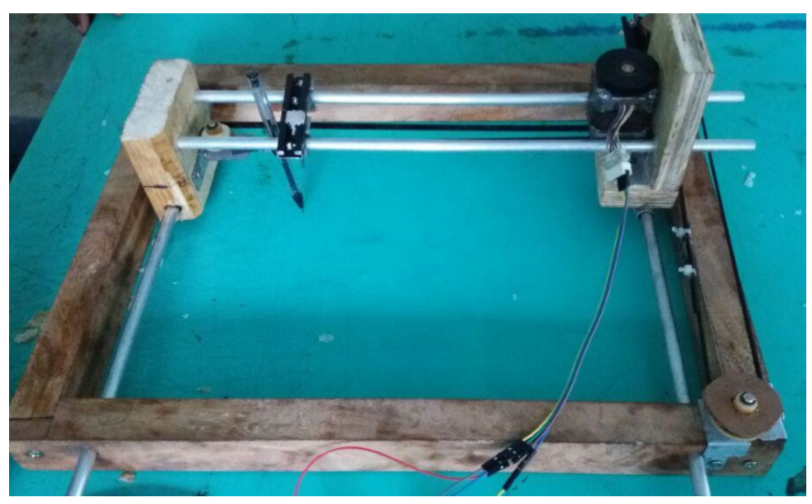
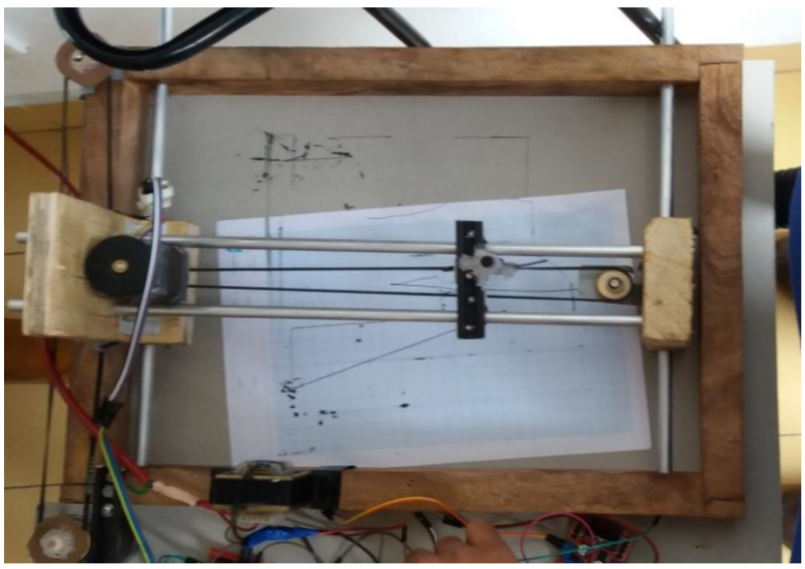
Using this Automated Graph Plotter, we can avoid these difficulties in drawing the graph in real time while the experiment is going on.


Comments